The proposed plan
What's planned at 1250 East 1200 North
Everything below comes from the school's own documents. Each claim shows the page it came from, so you can check it yourself.
At a glance
- 528students, K-7Study p. 8
- 2,172car trips a dayStudy Table 3
- 534trips, morning peak hourStudy Table 3
- 80parking stallsSite plan table
- 2driveways on 1200 NorthStudy p. 9
- ~54 / ~24cars on site: study vs. plan noteStudy p. 12 · C-200
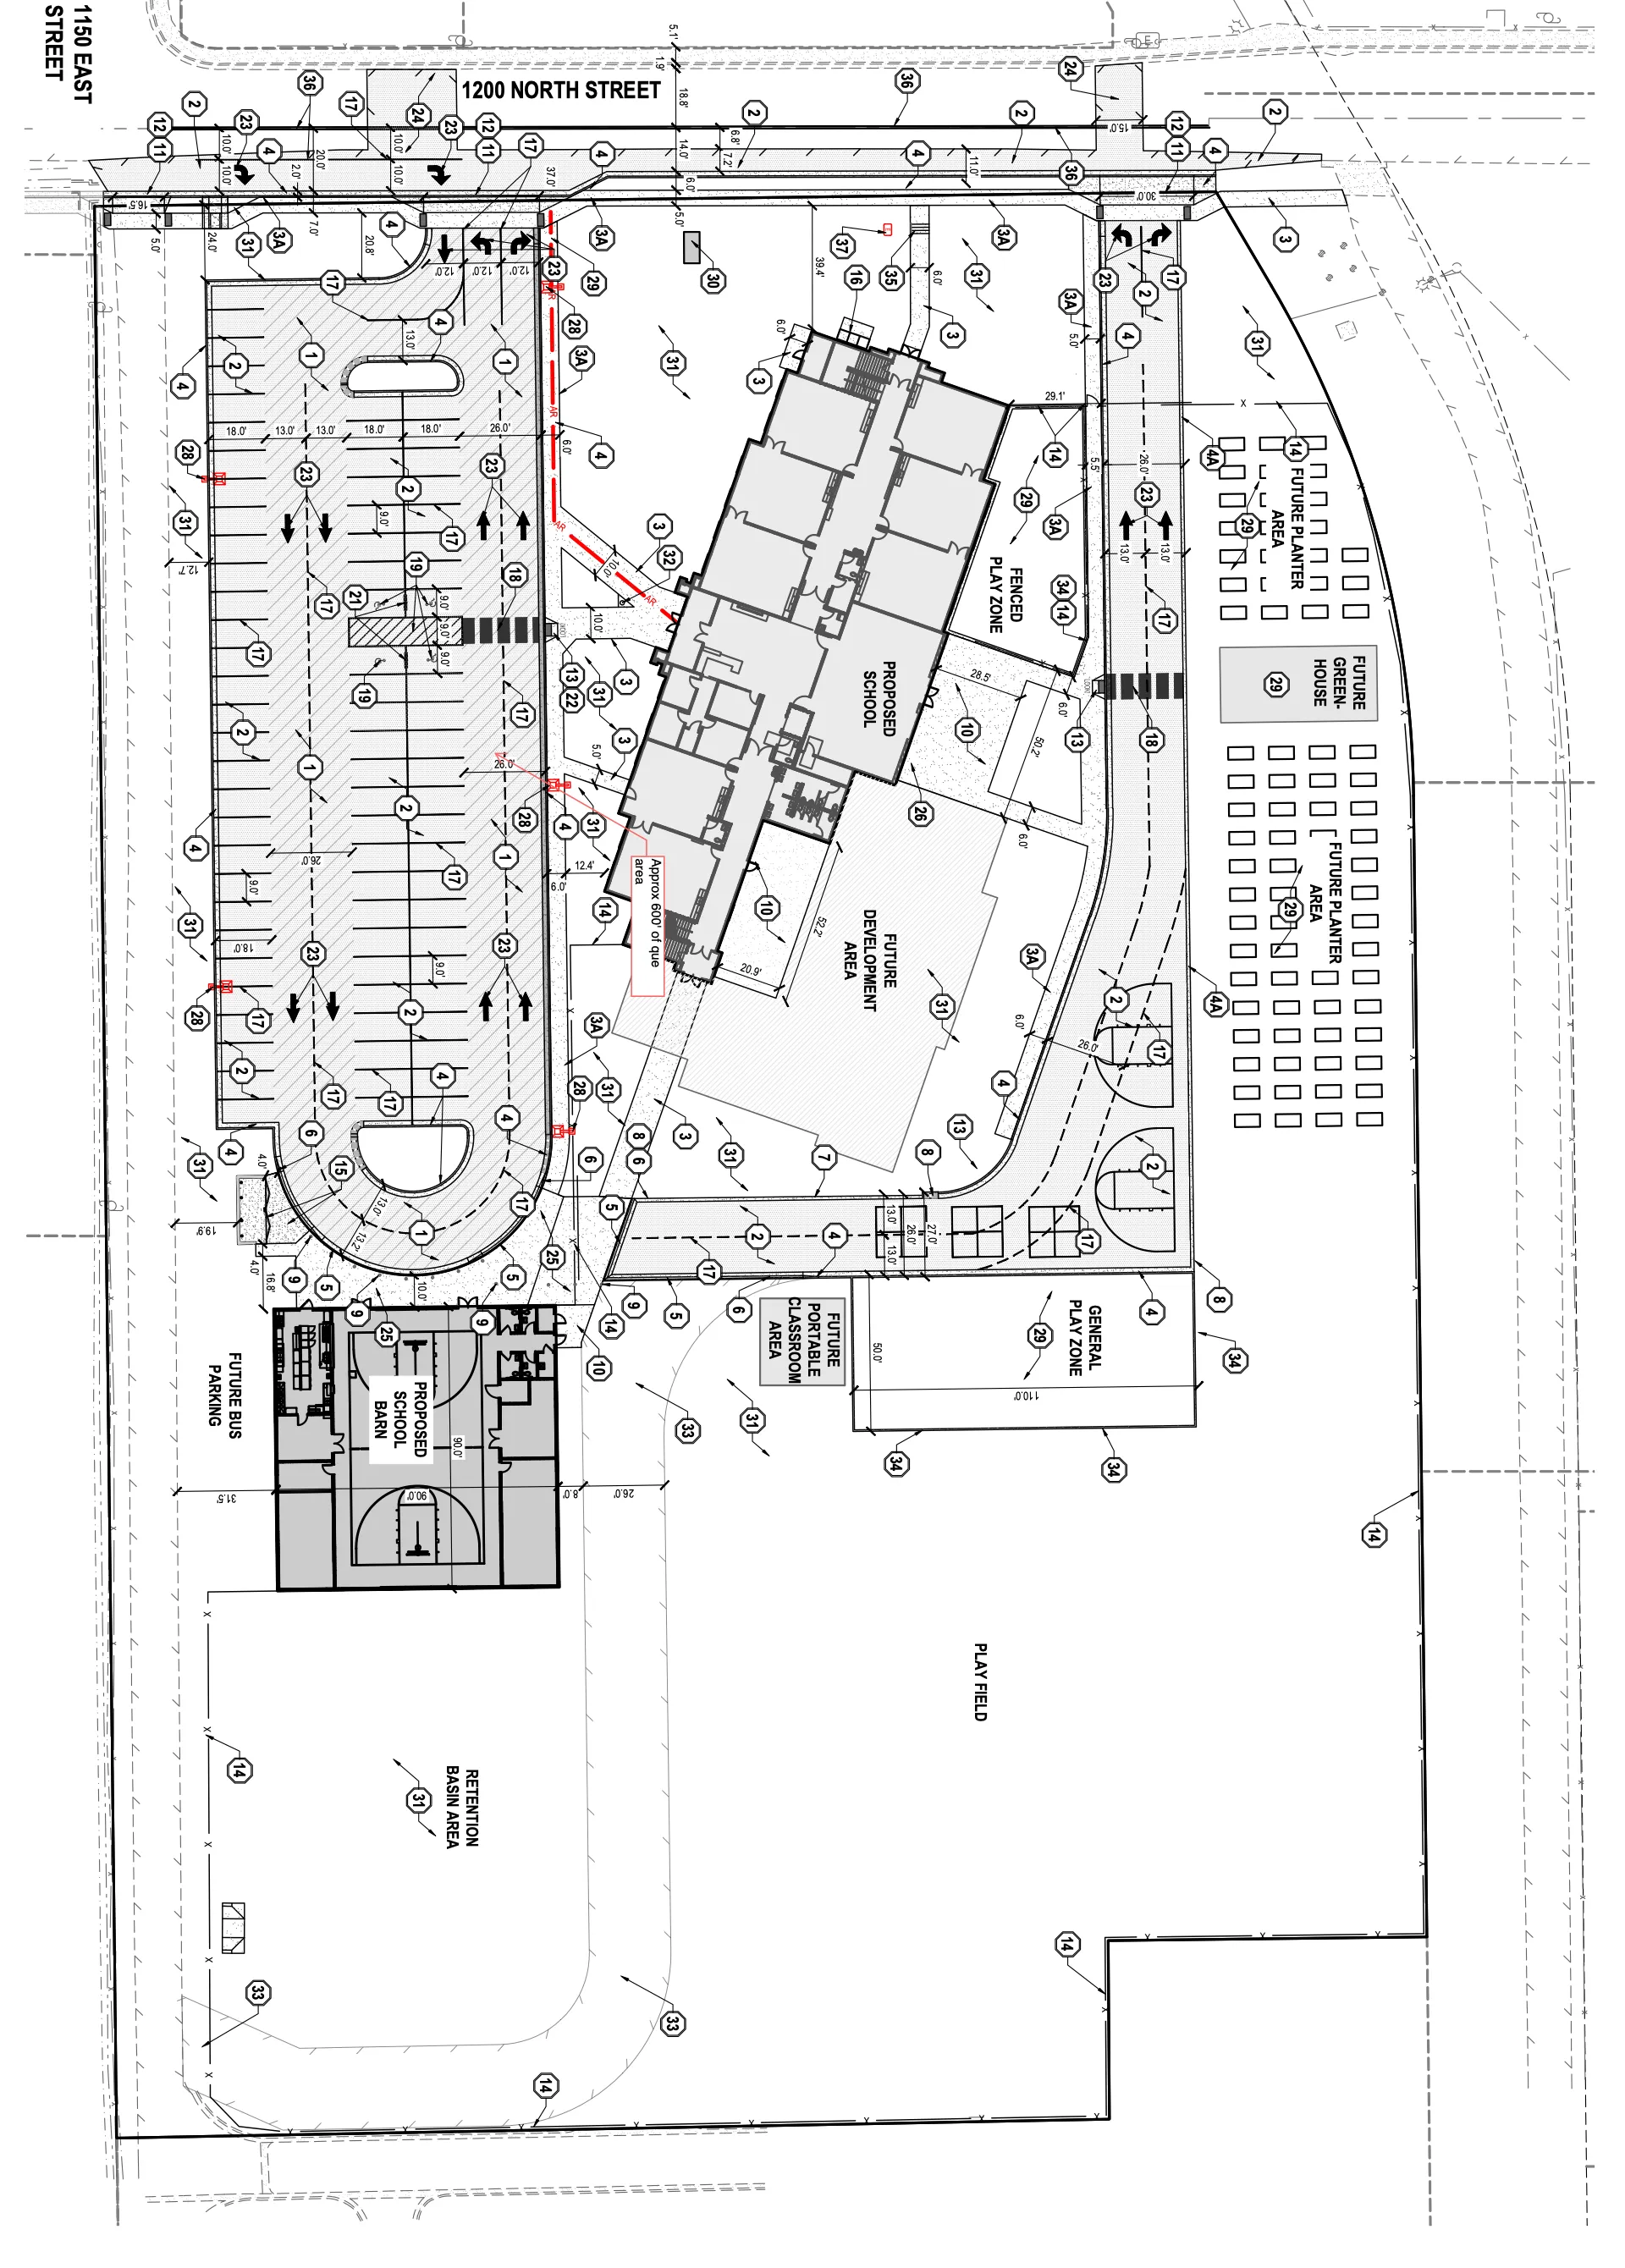
The site plan, annotated
Scroll sideways to see the full plan
- 1
Entrance about 100 ft from the 1150 East corner
Why it matters: That corner is next to Hobble Creek Elementary, across 1200 North from this site.
Traffic study p. 9 · Parcel data, UGRC
- 2
The car line loop
Why it matters: The study counts about 1,350 ft of space (~54 cars) for a modeled line of about 51. Three cars of slack.
Traffic study p. 12
- 3
Where the line would spill onto 1200 North
Why it matters: A note on the plan reads "Approx 600' of que area." If about 600 ft is right, roughly 24 cars fit on site and the rest of the line backs up onto 1200 North.
Site plan C-200
- 4
Space saved for future buildings, portables and buses
Why it matters: The plan also marks a "Future portable classroom area" and "Future bus parking." The traffic study only covers 528 students. What happens if the school grows?
Site plan C-200
- 5
A "school barn" gym building
Why it matters: Evening and event traffic was not studied.
Site plan C-200
Morning traffic on 1200 North
Hobble Creek Elementary and the proposed charter school would share one corner. This map shows the charter's traffic study numbers for the busiest hour of the school morning.
- East of Main Street522 → 753cars an hour on 1200 North: 231 more, up 44%Study, Fig. 2a and 4a
- Hobble Creek's corner117 → 588cars an hour on 1200 North between 1150 East and the driveway: about 5 times as manyStudy, Fig. 2a and 4a
- Main St and 1200 North8.6 → 28secaverage wait for northbound driversStudy, Appendix C (PDF p.39, 41). Northbound drivers only.
- New charter trips534cars in and out of the charter in the busiest morning hour: 299 in, 235 outStudy, Table 3 (PDF p.15)
Showing 2026 with the charter, busiest morning hour, all cars in both directions.
Cars per hour, busiest morning hour
- Under 100
- 100–199
- 200–349
- 350–499
- 500–649
- 650+
Main Street and 1200 North. Northbound drivers wait 8.6 sec on average (grade A). Line of cars in the northbound left/through lane: 100 ft.Northbound drivers wait 28.0 sec on average (grade D); the study rates the intersection as a whole C (21.9 sec). Line of cars in the northbound left/through lane: 350 ft, up from 100 ft.
Study, Appendix C (PDF p.39, 41); Table 5 (PDF p.20); Appendix D (PDF p.56, 58)
1150 East and 1200 North, Hobble Creek's corner. The study's only count here was taken in summer (Wed, June 24, 2026): 48 cars in the morning peak hour.The study's only count here was taken in summer (Wed, June 24, 2026): 48 cars in the morning peak hour.
Study, Appendix B (PDF p.36); text (PDF p.11)
Charter driveway. No driveway yet.208 left turns out and 264 right turns in during the morning peak hour. A second exit about 250 ft east was modeled as part of this one.
Study, Appendix C (PDF p.42); Fig. 4a; text (PDF p.16)
See every number in a table
| Stretch | 2026 without the charter | 2026 with the charter | Change | Source |
|---|---|---|---|---|
| 1200 North, west of Main Street | 247 | 370 | +123 | Hales traffic study, Fig. 2a and 4a, and Appendix C p.39 and 41 (Main St / 1200 N, west leg) |
| Main Street, north of 1200 North | 326 | 380 | +54 | Hales traffic study, Fig. 2a and 4a, and Appendix C p.39 and 41 (Main St / 1200 N, north leg) |
| Main Street, south of 1200 North | 527 | 581 | +54 | Hales traffic study, Fig. 2a and 4a, and Appendix C p.39 and 41 (Main St / 1200 N, south leg) |
| 1200 North, Main Street to midway | 522 | 753 | +231 | Hales traffic study, Fig. 2a and 4a, and Appendix C p.39 and 41 (Main St / 1200 N, east leg) |
| 1200 North, midway to 1150 East | 168 | 532 | +364 | Hales traffic study, Fig. 2a and 4a (1150 E / 1200 N, west leg) |
| 1150 East, north of 1200 North | 61 | 166 | +105 | Hales traffic study, Fig. 2a and 4a (1150 E / 1200 N, north leg) |
| 1200 North, 1150 East to the charter driveway (about 100 ft, Hobble Creek's corner) | 117 | 588 | +471 | Hales traffic study, Fig. 2a and 4a (1150 E / 1200 N, east leg) |
| 1200 North, east of the charter driveway | 117 | 178 | +61 | Hales traffic study, Fig. 2a (without the charter) and Fig. 4a (with the charter) |
| Charter driveway | – | 534 | – | Hales traffic study, Table 3 (PDF p.15): 299 cars in, 235 out |
Cars in the busiest morning hour, both directions, added up from the study's traffic-volume figures (Fig. 2a and 4a).
Method and sources
Numbers. Each street's number is the cars arriving on it plus the cars leaving onto it, in the busiest morning hour, from the study's traffic-volume figures (Fig. 2a without the charter, Fig. 4a with it), which match Appendix C at Main Street. Where a stretch of 1200 North sits between two study intersections, each half uses the nearer intersection; the midway split is drawn at the halfway point. Source: Hales Engineering traffic study, Aug 12, 2026.
Street lines. © OpenStreetMap contributors (ODbL), retrieved Oct 2026. The charter driveway is not in OpenStreetMap; it is drawn about 100 ft east of 1150 East, as the study describes (PDF p.16). Its position is approximate.
School parcels. Utah Geospatial Resource Center (UGRC) / Utah County parcel data, informational only, not a survey.
Moving dots. One dot for about every 25 cars an hour, split between the two directions, all moving at the same speed. Moving dots show how many cars the study expects in the busiest morning hour. They are not a model of real car movements.
Traffic Impact Study, Hales Engineering, Aug. 12, 2026. Public record.
What the traffic study missed
Scroll sideways to see the full table
| Issue | What the study says | Why it matters | Source |
|---|---|---|---|
| Counted in summer | Counts at the 1150 East corner were taken Wed, June 24, 2026, then scaled using a US-89 highway sensor. | Hobble Creek was out of school. A highway factor can't recreate an elementary drop-off rush. | p. 4-5, App. B |
| No Hobble Creek | No mention of the elementary school, pedestrians, crossings, walking routes or buses. | It measures how long cars wait, not whether kids are safe. | Full-text search |
| Morning not modeled for the car line | The on-site line was sized using afternoon pick-up only. | The morning has 534 trips vs. 318 in the afternoon. | p. 8, 12 |
| Narrow study area | Three intersections, chosen "based on conversations with the development team." | 45% of trips are assigned to and from the north, but only three intersections were studied. | p. 2, Table 4 |
Source for every row: Traffic Impact Study, Hales Engineering, Aug 12, 2026.
See something in this plan that worries you?
The city asks for specific comments on access, traffic flow and pedestrian safety.